Performance Management
Key to the efficient operation of any service mesh is the measurement and management of it’s performance.
Performance Profiles
Performance Profile is a new and improved way to save performance test configurations, schedule performance tests, etc. Meshery Performance Profiles offers the following features:
- Saving Test Configurations
- Create schedules for running tests automatically.
- Meshery offers UI for describing the schedules which are as powerful as CRON but without the hassle of remembering its syntax!
- All the tests performed are under Profiles which has multiple advantages like:
- Access test results ran under a certain profiles at one place.
- If running ad-hoc tests, user can anytime come back and rename the performance profiles for re-use.
Load Generators
Meshery provides users with a choice about the kind of load generator they prefer to use for a given performance test. Users may set their configure based on their own preference of load generator different from that of the default load generator.
Meshery supports the following load generators and is extendible to support others:
fortio
Fortio is a fast, small (3Mb docker image, minimal dependencies), reusable, embeddable go library as well as a command line tool and server process, the server includes a simple web UI and graphical representation of the results (both a single latency graph and a multiple results comparative min, max, avg, qps and percentiles graphs).
wrk2
It is a modern HTTP benchmarking tool capable of generating significant load when run on a single multi-core CPU. It combines a multithreaded design with scalable event notification systems such as epoll and kqueue.
Nighthawk
NightHawk is an L7 (HTTP/HTTPS/HTTP2) performance characterization tool. It currently offers:
- A load testing client which supports HTTP/1.1 and HTTP/2 over HTTP and HTTPS. (HTTPS certificates are not yet validated).
- A simple test server which is capable of generating dynamic response sizes, as well as inject delays.
- A binary to transform nighthawk output to well-known formats, allowing integration with other systems and dashboards.
Configuring performance testing settings
Meshery provides a highly configurable set of load profiles with various, tuneable facets, including support for generating TCP, gRPC, and HTTP load with optional configuration of the performance test’s:
- Duration
- Concurrent Threads
- Concurrent Generators
- Load Generator Type
- Custom HTTP Headers
See Service Mesh Performance (SMP) for a full description of the different types of performance tests that Meshery provides.
Using Performance Test Profiles
As Meshery user you can customize and save your load test configuration in the form of a Performance Test Profile. Using Performance Test Profiles, you can return to Meshery to run the same set of customized tests again and again, tracking variations in performance overtime.
Comparing Test Results and Service Meshes
Meshery users can easily compare the difference in request performance (latency and throughput) between independent performance tests. Statistical analysis is run upon finalization of every performance test and presented in the form of a histogram with latency buckets.
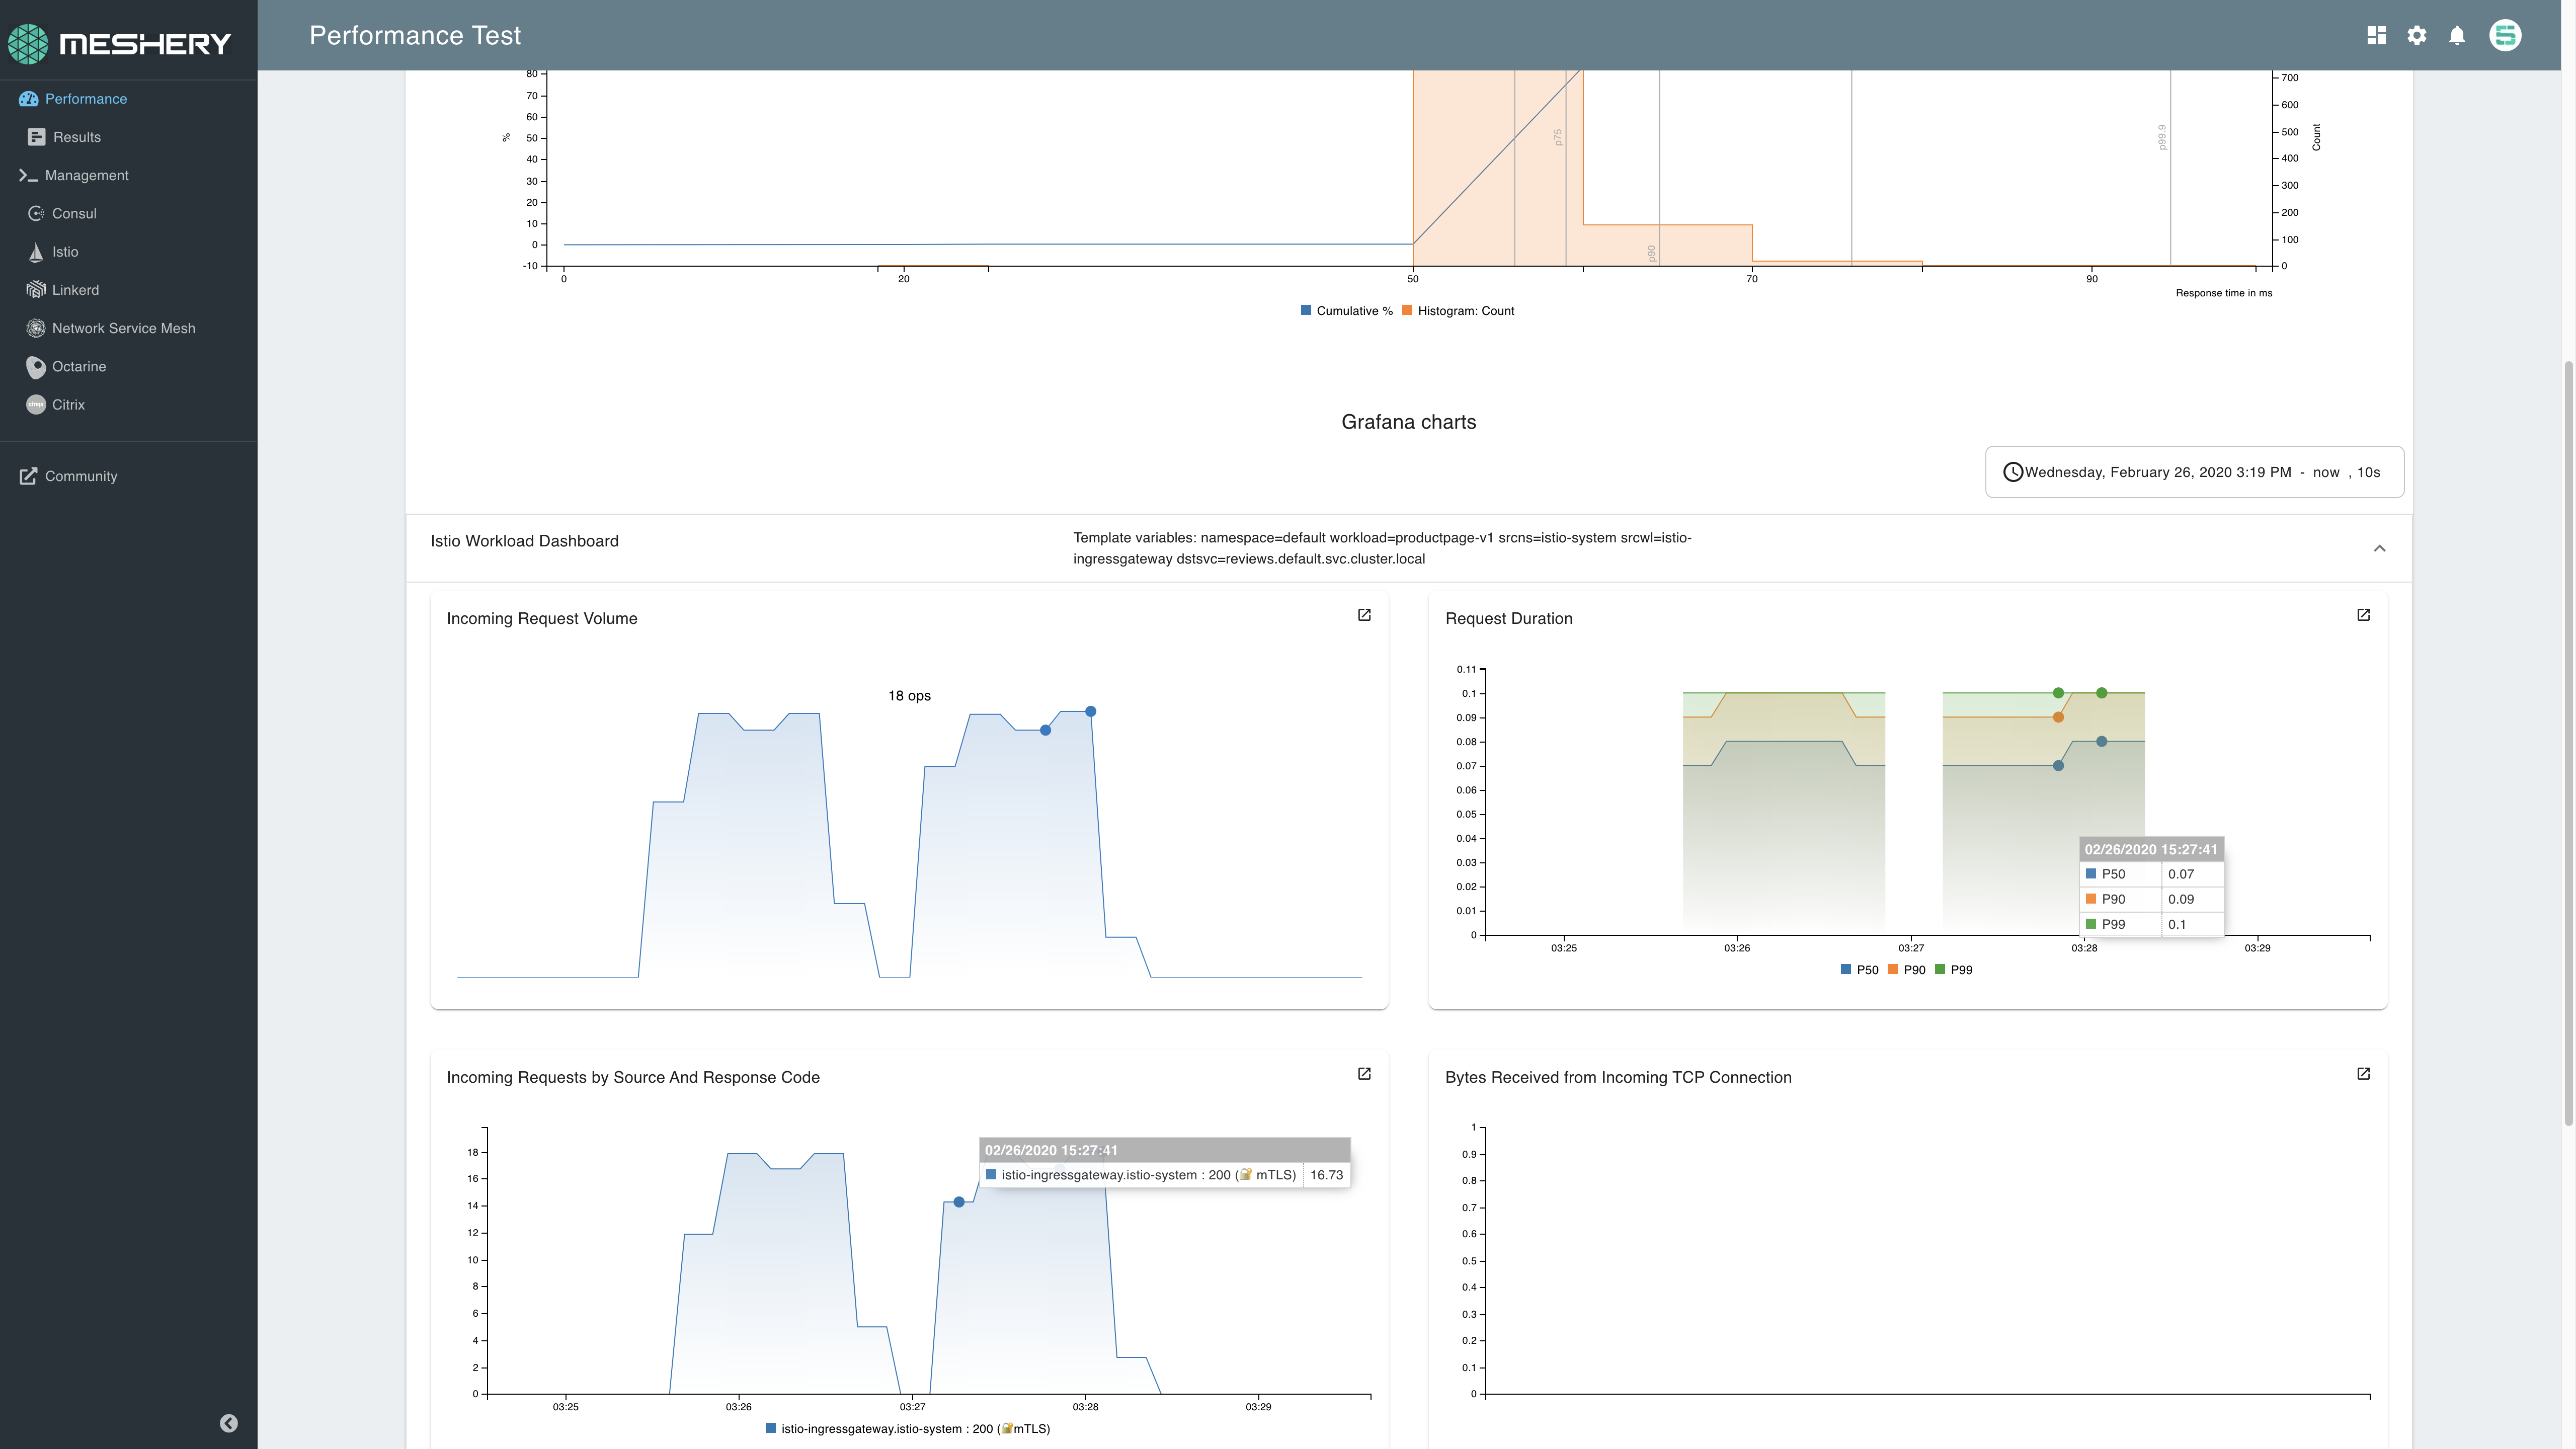
Kubernetes Cluster and Service Mesh Metrics
Meshery provides performance test results alongside environment metrics, including service mesh control and data plane metrics as well as cluster node resource metrics, so that operators may easily understand the overhead of their service mesh’s control plane and data plane in context of the overhead incurred on nodes within the cluster.
Grafana and Meshery
Connect Meshery to your existing Grafana instance. Meshery will auto-import the boards of your choosing:
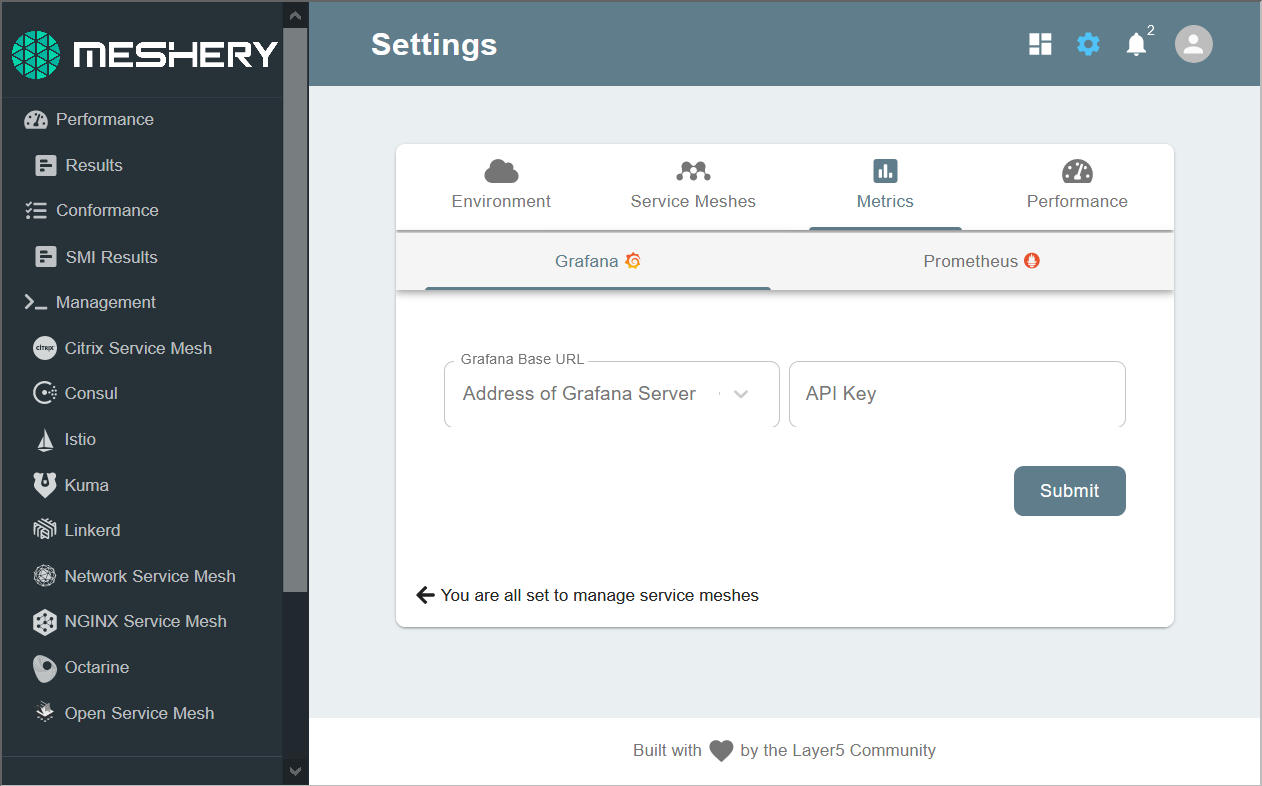
Connecting to Grafana
If you have an API key configured to restrict access to your Grafana boards, you will need to enter the API key when establishing Meshery’s connection to Grafana. You may also set up a Grafana board and then set up an API key:
- Import Grafana boards
- Import existing Grafana boards via API
- Import custom Grafana board via yaml
- Configure graph panel preferences
Prometheus and Meshery
Meshery allows users to connect to one or more Prometheus instances in order to gather telemetric data (in the form of metrics). These metrics may pertain to service meshes, Kubernetes, applications on the mesh or any other metric that Prometheus has collected.
Once you have connected Meshery to your Prometheus deployment(s), you may perform ad-hoc connectivity tests to verify communication between Meshery and Prometheus.